We’ve heard the phrase “It’s a make or miss league”. It’s used by many in NBA circles to boil the game down to its simplest premise—you must make shots to win.
It’s also the principal behind the emphasis that NBA teams put on shot selection; finding the most efficient shots—those that are most makable or garner the most points per attempt on average. These, for most teams, are shots at the rim (players make these at high rates) and shots behind the 3-points line (you get an extra point behind the line). Coaching staffs spend a lot of time creating offensive structures and plays to generate such shots and not others.
But the “make or miss” maxim doesn’t capture the whole picture as it relates to winning basketball games. It’s missing the fundamental truth that you must first take a shot to make a shot.
The NBA is a not a Make or Miss League, it’s a Take and Make League.
The concept
The number of shot attempts a team has in a game does not get a lot of play in the world of NBA commentary and data mashing. We hear much more about offensive efficiency as a whole and shot percentages from various locations on the court or opponent’s shooting percentages as metrics of success.
But ponder this…
All basketball possessions end with (1) a made field goal attempt, (2) a missed field goal attempt and rebound, or (3) a loss of possession—a turnover. If you are doing the 3rd thing, then you can’t do the 1st thing. Turning the ball over is the same as attempting a field goal that has a zero percent chance of going in. It’s the worst possible outcome of an offensive possession.
And the pain doesn’t end when you lose the ball.
The turnover always turns into a potential scoring opportunity for your opponent, often yielding high-percentage shots off fast breaks of transition offense. Turnovers can deflate a team’s confidence and provide an energy boost to their opponent and swing momentum in minutes or seconds. It’s not only that your team just chucked the ball into the third row—bad things happen after.
Conceptually, turning the ball over more often than your opponent should impact a team’s chance of winning. If you’re not shooting, you’re not scoring and, thus, you’re not winning.
But is that really true?
The data
Do teams’ turnover rates correlate with the number of games they win?
To answer that core question, we considered teams’ turnover rates and total wins over the last 10 complete seasons. First, we compared average wins per season between teams that had above average per-game turnovers (bad hands) and teams with below average turnover rates (good hands). We then compared the average wins per season of teams with very-high turnover rates in the bottom 15% of all team/seasons (the truly bad turnover teams) to the wins for teams with very low rates—the top 15% (the really good hands teams).
And… we found that the conceptual model was right. Turnovers matter. And they matter a lot. Shocking, I know.
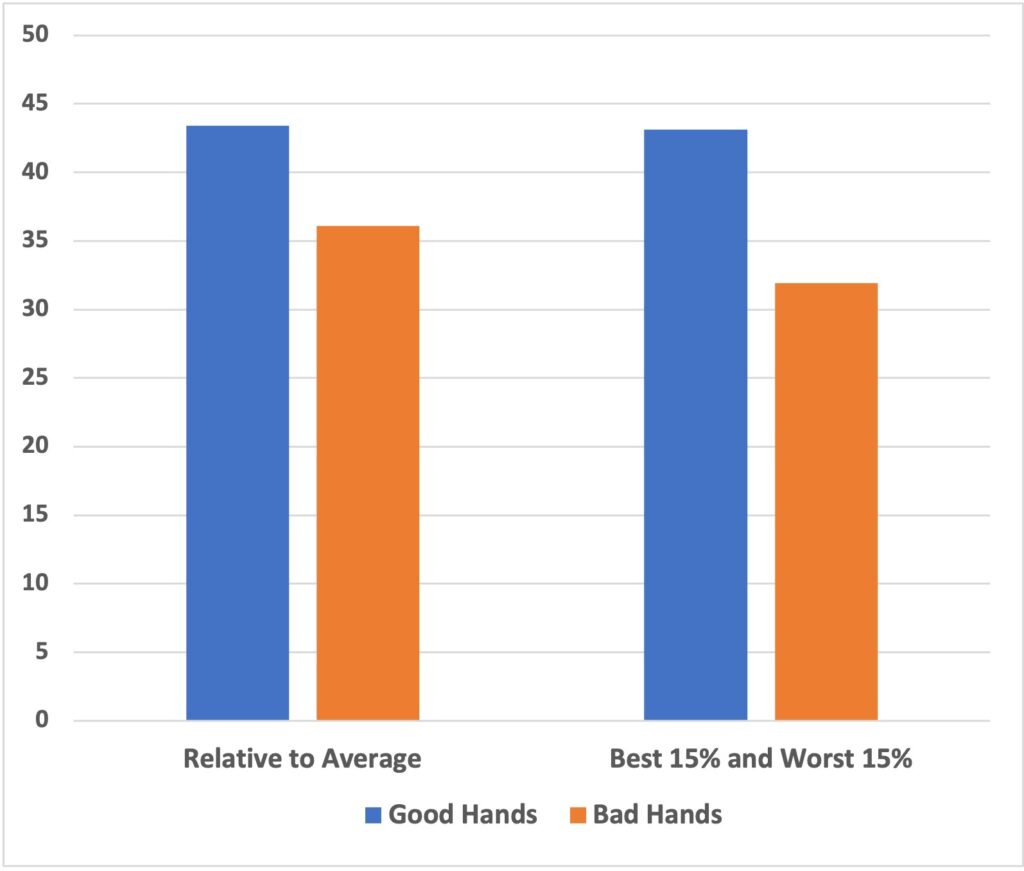
Teams with worse than average turnovers (computed for the last 10 seasons and these included the Covid shortened seasons) averaged 36.1 wins per season. Teams with better than average turnover rates average 43.4 wins pers season. A greater than seven-game difference between one-half of the data set and the other. That’s big! That’s not just statistically significant (yes, we did run those tests), it’s substantial with respect to a team’s perceived success and playoff opportunities.
It gets better. Teams in the bottom 15% turnover rates (very bad hands) during the last 10 seasons averaged 31.9 wins per season compared to 43.1 wins per season for teams in the top 15% turnover rates (very good hands). The very good ball control teams won about 11 more games per year on average than the truly sloppy teams.
Comparisons of turnover differential (difference between a team’s turnover rate and their opponent’s turnover rate) show similar differences although, surprisingly, with a slightly lower magnitude. Below average TO-differential teams (more TO’s than their opponents) win about 5 games per year less than above average TO-differential teams (teams with less turnovers than their opponents). Bottom 15% differential teams win about 9 less games per year than the top differential average teams.
These differences were consistent when we looked at each year individually, with a slight trend toward larger differences in win-loss differential in more recent seasons.
Bottom line—turnover rate correlates significantly with wins per season. Teams with worse than average turnover rates generally lose more games per season than teams with better than average turnover rates. The difference in those averages (means) is statistically significant and relevant to a team’s playoff opportunities.
Sure. There are teams that have had turnover problems but continue to win. They show up throughout the data set. But the numbers indicate that these teams are not the norm. You turn the ball over a lot… you are, on average, losing more games than those that don’t.
Now what?
So, turnovers matter. They matter a lot. So what?
As fans of a bad Utah Jazz team that continually shoots themselves in the foot, and hand, and leg, by turning the ball over, we’d all like to think there is something that can be done about it. And there is, else there wouldn’t be teams that average 12 turnovers a game while your team is averaging 16.
Within Utah’s ineptitude are examples of turnover-related execution issues that we think can be corrected—sloppy teams should be able to get better. Many teams have some of these issues, so all should listen up. The effect of pace is one example. The Jazz are slow up the court. They’re often operating against a well-set defense late in the clock. The result is a more hurried attack with few good passing options. They over dribble into the key, get stripped and away it goes. So play less against the set. Play more out of transition and early offense. Give yourselves more time to create passing lanes by moving quickly and strongly into your offense.
The Jazz are also guilty of making the “automatic” pass to get into their stuff, even when danger lurks. Defenders know where that first pass is going and will jump it. The Jazz tend to make the pass anyway instead of backing away and trying a different action. The Jazz can Improve offensive execution using secondary and tertiary options to get the ball up the court and into the offense—be faster and less predictable.
Utah, and other poor ball-control teams, can help themselves by improving screening technique, spacing. and reaction to double teams. Ooh, and Jazz, feel free to create some turnovers on the other side—Utah is last in the league in opponent’s turnovers and turnover differential.
We know the Jazz are trying to lose at this stage. But bad habits can last. They can cross seasons. They should be working on this stuff, because… It’s the turnovers, stupid.
Take and make baby… take and make.